Fancy Math Predicts the Future
In 2012 I took Dr. Dragan Djurdjanovic's class at The University of Texas at Austin on time-series analysis using autoregressive-moving-average models, or ARMA models. Despite the jargon-y sounding terms, the class ultimately was about predicting the future, and who doesn't think that's awesome?
Basically these ARMA models are one way to statistically represent a long set of numeric data that perpetually varies with respect to another variable. Usually it's used for data varying with time, like stock prices or sensor data. As I understand it, the ARMA model says that the value of any data point depends on the data points that precede it, in some measurable, predictable way (hence "autoregressive"); i.e. the stock price today depends on the stock price yesterday, and the day before, and the day before, etc. The ARMA model also says that the value of any data point depends on previous deviations from the purely autoregressive model, as well (hence the "moving average" part). Taken all together, in this example, ARMA models boldy cast aside all the analytical theories of what could be affecting stock prices -- ignoring things like consumer confidence, housing prices, unemployment, GDP, the value of the euro, you name it -- and instead the ARMA model says that you can predict stock prices today purely based on the stream of past stock prices that we've already recorded. Any deviations from that model are random noise, and even this noise can be predicted to some degree, if you build your model correctly. Neat, right? And maybe dangerous if misused! So maybe now you understand my interest in this, despite my dislike of all the jargon.
You can also use ARMA models to represent the number of car crashes that occur in a place over time, which is what I did for my final project in Professor Djurdjanovic's class. I thought I could characterize car crashes in Texas and Illinois and see if ARMA models accurately predicted seasonal crashes. Conclusion: It does OK. Not the most exciting result, but in this case the journey was worth more to me than the destination. To complete the project I had to do all sorts of work thinking and programming in MATLAB, thankfully using some of Djurdjanovic's pre-made ARMA model code by the end of that semester, to speed things up. I think the ARMA model was much more interesting for understanding cycles of car crashes rather than for predicting them (at least for the foundational models I created).
I hope someone else creates ARMA models for all fifty American states' car crash data, to compare. How are the states' models similar or different? Are the seasonalities of crashes the same? Do all locations have similar distributions of ARMA model orders across different time periods? Let me know if you do that!
You can download my report on predicting car crashes using ARMA modeling by clicking the link here or below. My original MATLAB code and source data used for the report are also downloadable. You can also fork the code on Github, and if ever I update this code you can check it out there. It would be great if I got any pull requests to fix up the code or to get more data from other states. Thanks again to the Texas Department of Transportation and the Illinois Department of Transportation for providing me with this public data in a form that was much easier for me to use. Government institutions still do help others get an education! For a few details of the report, you can also read below.
References:
- Wikipedia article on ARMA models
- Download my report on predicting car crashes using ARMA modeling
- Download a .zip of my MATLAB code and data used for the report
- Fork the code on Github
- MATLAB software available from MathWorks
- GNU Octave software available from GNU, as a free, open-source alternative to MATLAB. I haven't checked if my files work on Octave, but you can try.
Snippets of the Report
Honestly I very quickly forgot many of the details behind the math and programming of this project, but I do know that at one point, I really did know what I was talking about pretty deeply (probably just for the last week around the due date for this project). The report linked above assumes a lot of knowledge already about ARMA models, but it's possible to spend some time learning, or re-learning, all these topics, if that floats your boat. However, some of the main findings that still interest me are summarized below.
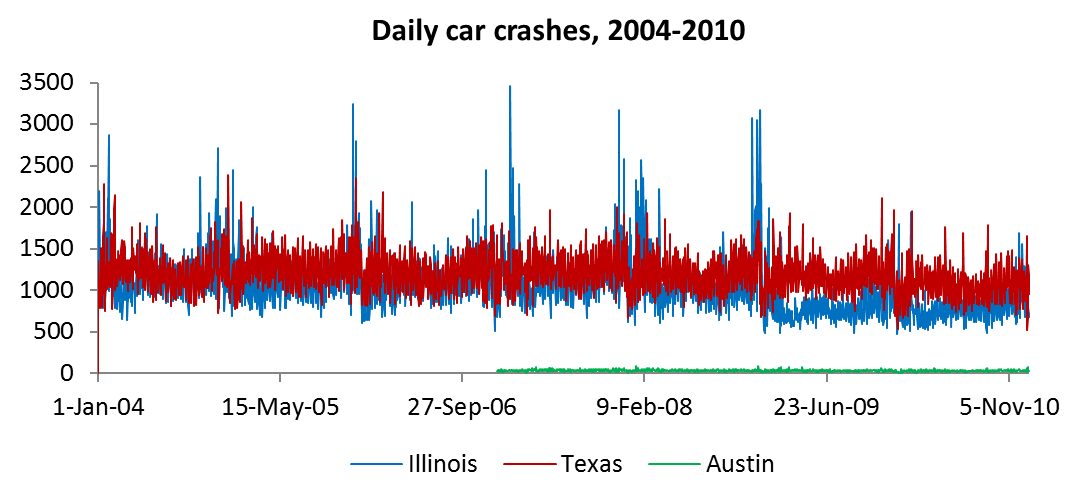
Apparently governments are only required to keep track of the more severe car crashes that result in greater monetary loss or physical casualties. The number of these crashes every day from 2004-2010 are shown in this graph below.
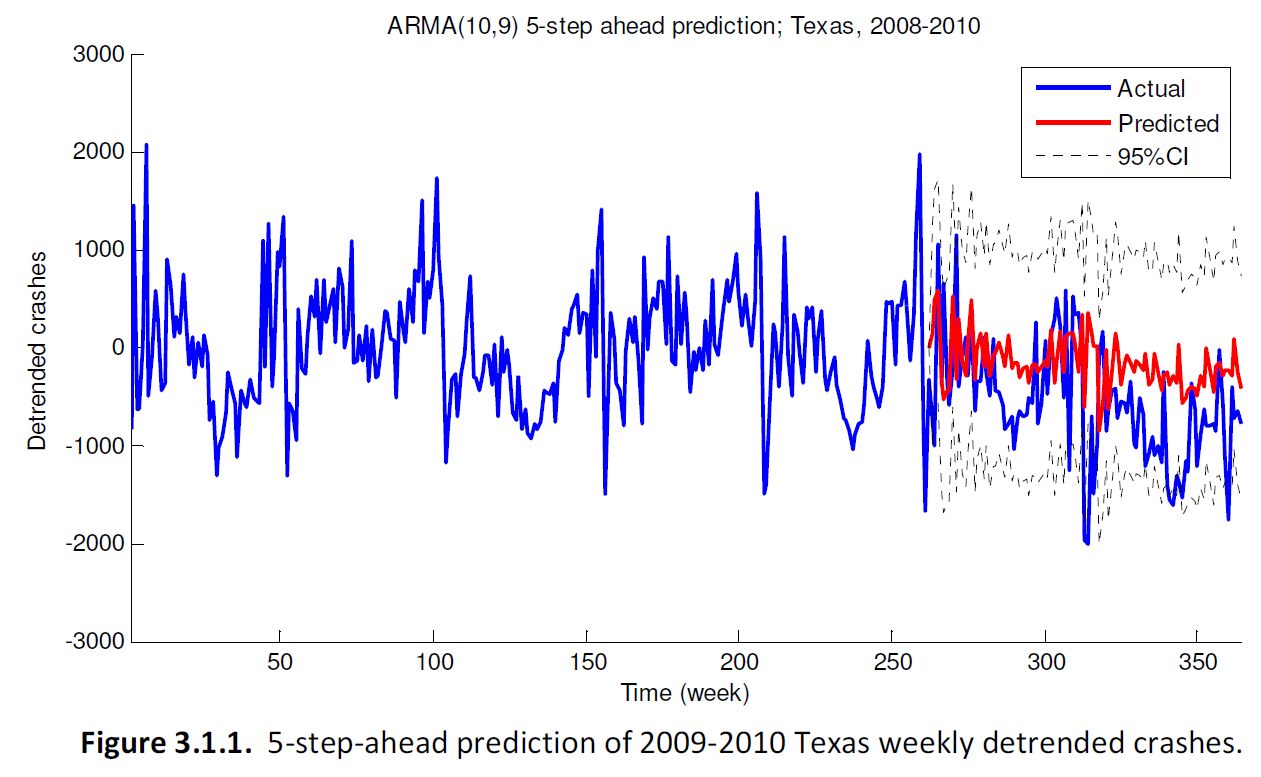
ARMA models were generated for the data, which were analyzed in several different ways. That showed many seasonalities in crash patterns, such as cyclic spikes in the data every week or every six months, maybe related to the work week and the weather, respectively. Then an ARMA model was evaluated to see if it could predict future car crash numbers using data from a month in the past and older. For example, an ARMA model (of AR order 10 and MA order 9) was used to represent Texas crashes from 2004-2008, and then it was used to simulate reality, predicting the crash numbers for 2009-2010 week by week (seen in red below). The predictions were compared to the actual data from 2009-2010, and, yep, the model does OK.
That was probably one of the better cases, though, because as it says in the report, the Illinois crash time series was "non-stationary", and so the ARMA model fell apart as a predictive tool. As a side thought, I wonder if the economic downturn of 2008 led to fewer drivers in Illinois at that time, leading to that change in the average numbers...
The most interesting result of the project to me was actually the observation of how ARMA models of the same time-series can change, depending on which "window" of data you use to create your base model. For example, I ran my ARMA modeling code in a loop on my time series data for Texas (weekly crashes); except in each loop the model was based on a slightly different 2-year window of data. Then after testing lots and lots of different windows, I plotted a histogram of the orders of the many different ARMA models that resulted. This historgram, to me, seems like some unique characterization of the data from Texas. You could say that most of the time, an ARMA model of Texas crashes will have a particular set of orders. The histograms for both Texas and Illinois are shown below.
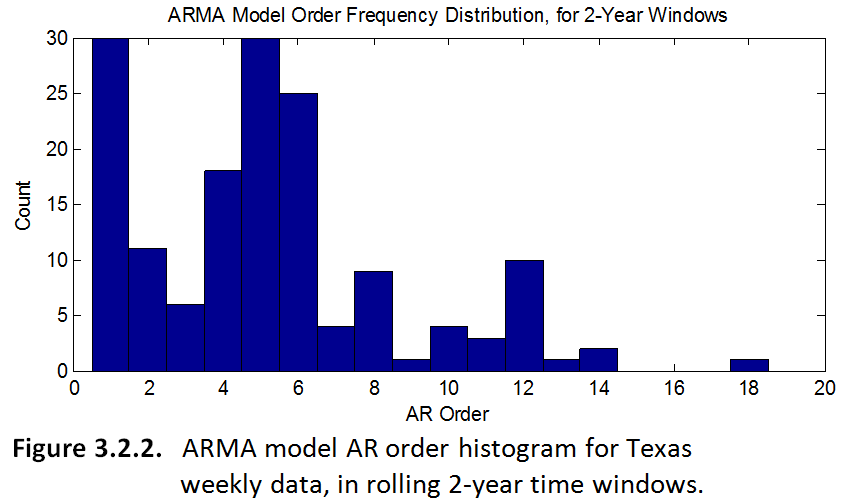
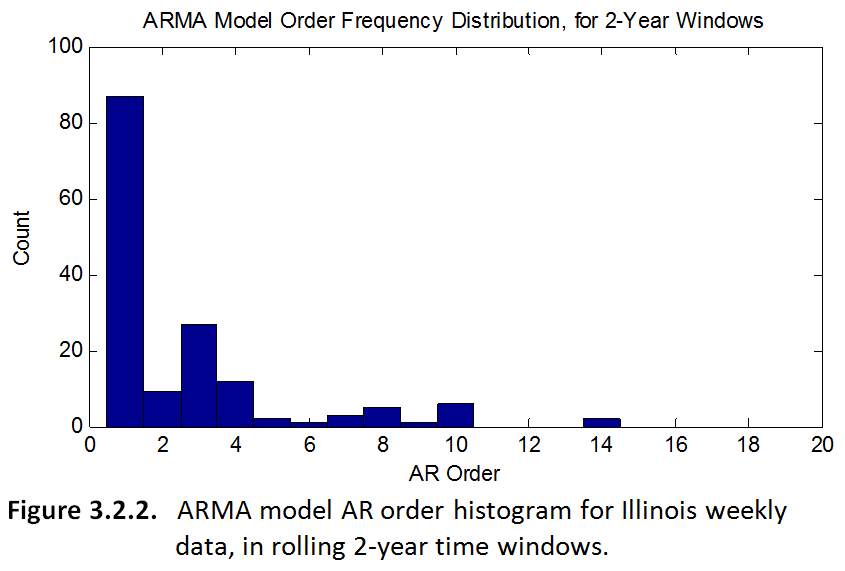
I'd be very interested to see analogous histograms for the ARMA models of crashes in all the other states, to see if they are similar or different, and how. Clearly the ARMA model orders are not random, but maybe certain locations are just more complex than others. In this case, maybe Texas just has a more complex set of variables that come into play in causing car crashes, as evidenced by its expected higher-ordered ARMA models.